 AI
AIBeginner
Compare AI Visuals from Different Engines
Compare leading image-generating AI models side-by-side. View results, speed, cost, and quality.
25s$0.114
Convert raw spreadsheet-like data into a line chart image
Use This Template
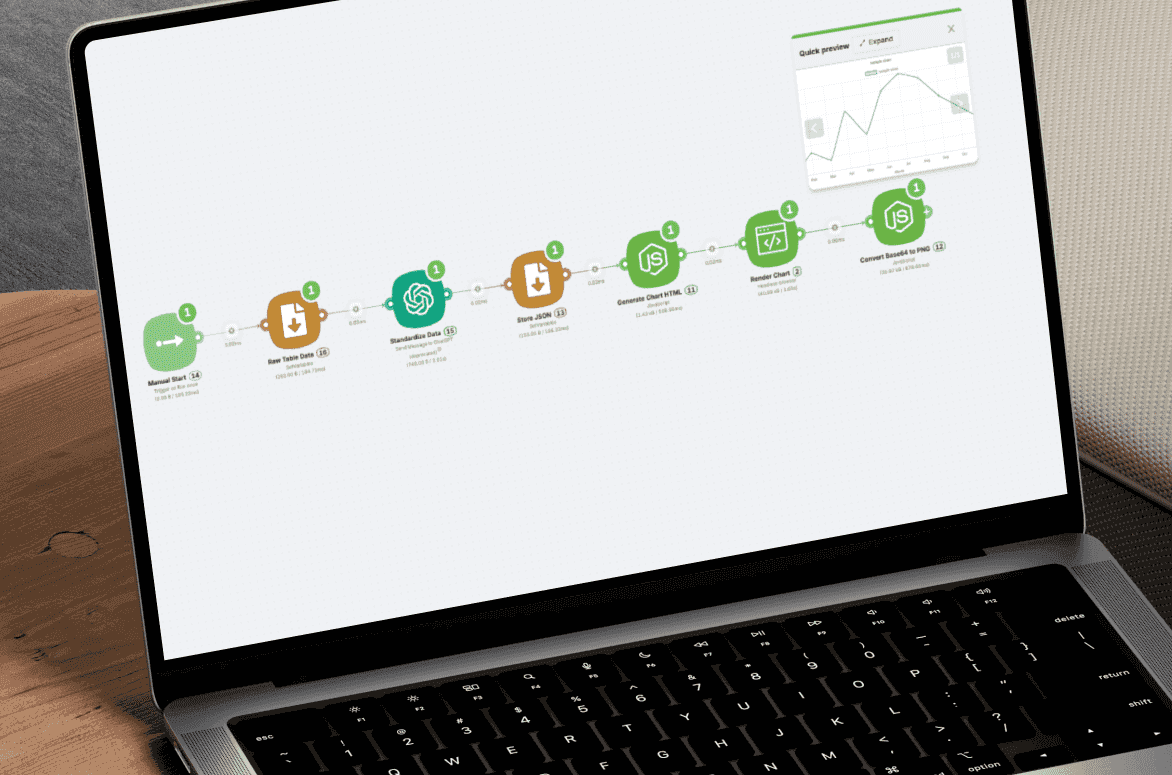
This automation transforms spreadsheet-like input into a visual chart. It starts with raw data, uses ChatGPT to extract labels and values into structured JSON, then creates an HTML-based Chart.js line chart. This chart is rendered in a headless browser, and the canvas is captured as a base64-encoded PNG image. Finally, the base64 buffer is converted into a clean image. Ideal for anyone looking to turn raw or tabular data into visual reports quickly and automatically.
More templates
AICompare leading image-generating AI models side-by-side. View results, speed, cost, and quality.
 AI
AIGenerate viral posts by recording a quick voice note.
 AI
AIGet daily news updates and weather forecasts delivered straight to your inbox.